Campaign Results
Led a full redesign of Campaign Results, rethinking the platform from the ground up with a multichannel perspective. That meant exploring product data, talking to users, and partnering with business and engineering teams to rebuild the entire data visualization system.
Made with

Camila Bruno, Design lead

Juliana Caputo, Staff Research

Murilo Augusto, Product Owner

Tharcyla Mourao, Product Owner

Igor Motta, Data lead

Leonardo Guimarães, Dev Lead

Jessica Rufino, Business Analyst

Renan Iti, Business Coord
1
Context
Known primarily as a broadcast TV network in Brazil, Globo has expanded its advertising portfolio significantly over the years — and each new product arrived with its own systems and metrics. Globo Ads was built to bring these results to advertisers in one place.
But today, that data is still siloed by channel — Broadcast TV, Paid Channels, Digital, and more — each with its own dashboards. The result mirrors how these products were built internally, not how advertisers actually think about their campaigns.
2
The problem
With far more ways to advertise through Globo — social, out-of-home, audio — and with the line between TV and digital increasingly blurred, this siloed way of presenting information won't scale as the business keeps growing.
The challenge then, is how to show this multichannel information without overwhelming the user and losing sight of the workflows they were accustomed to.
3
The challenge
Beyond fix the navigation, the business want to evolve the plataform into an insights hub. But before sketching a single screen, we realized we didn't actually know the basics: Why do users open the platform in the first place? Which features are truly indispensable, which are noise, and what's missing entirely? And critically — what does "an insight" even mean to them?
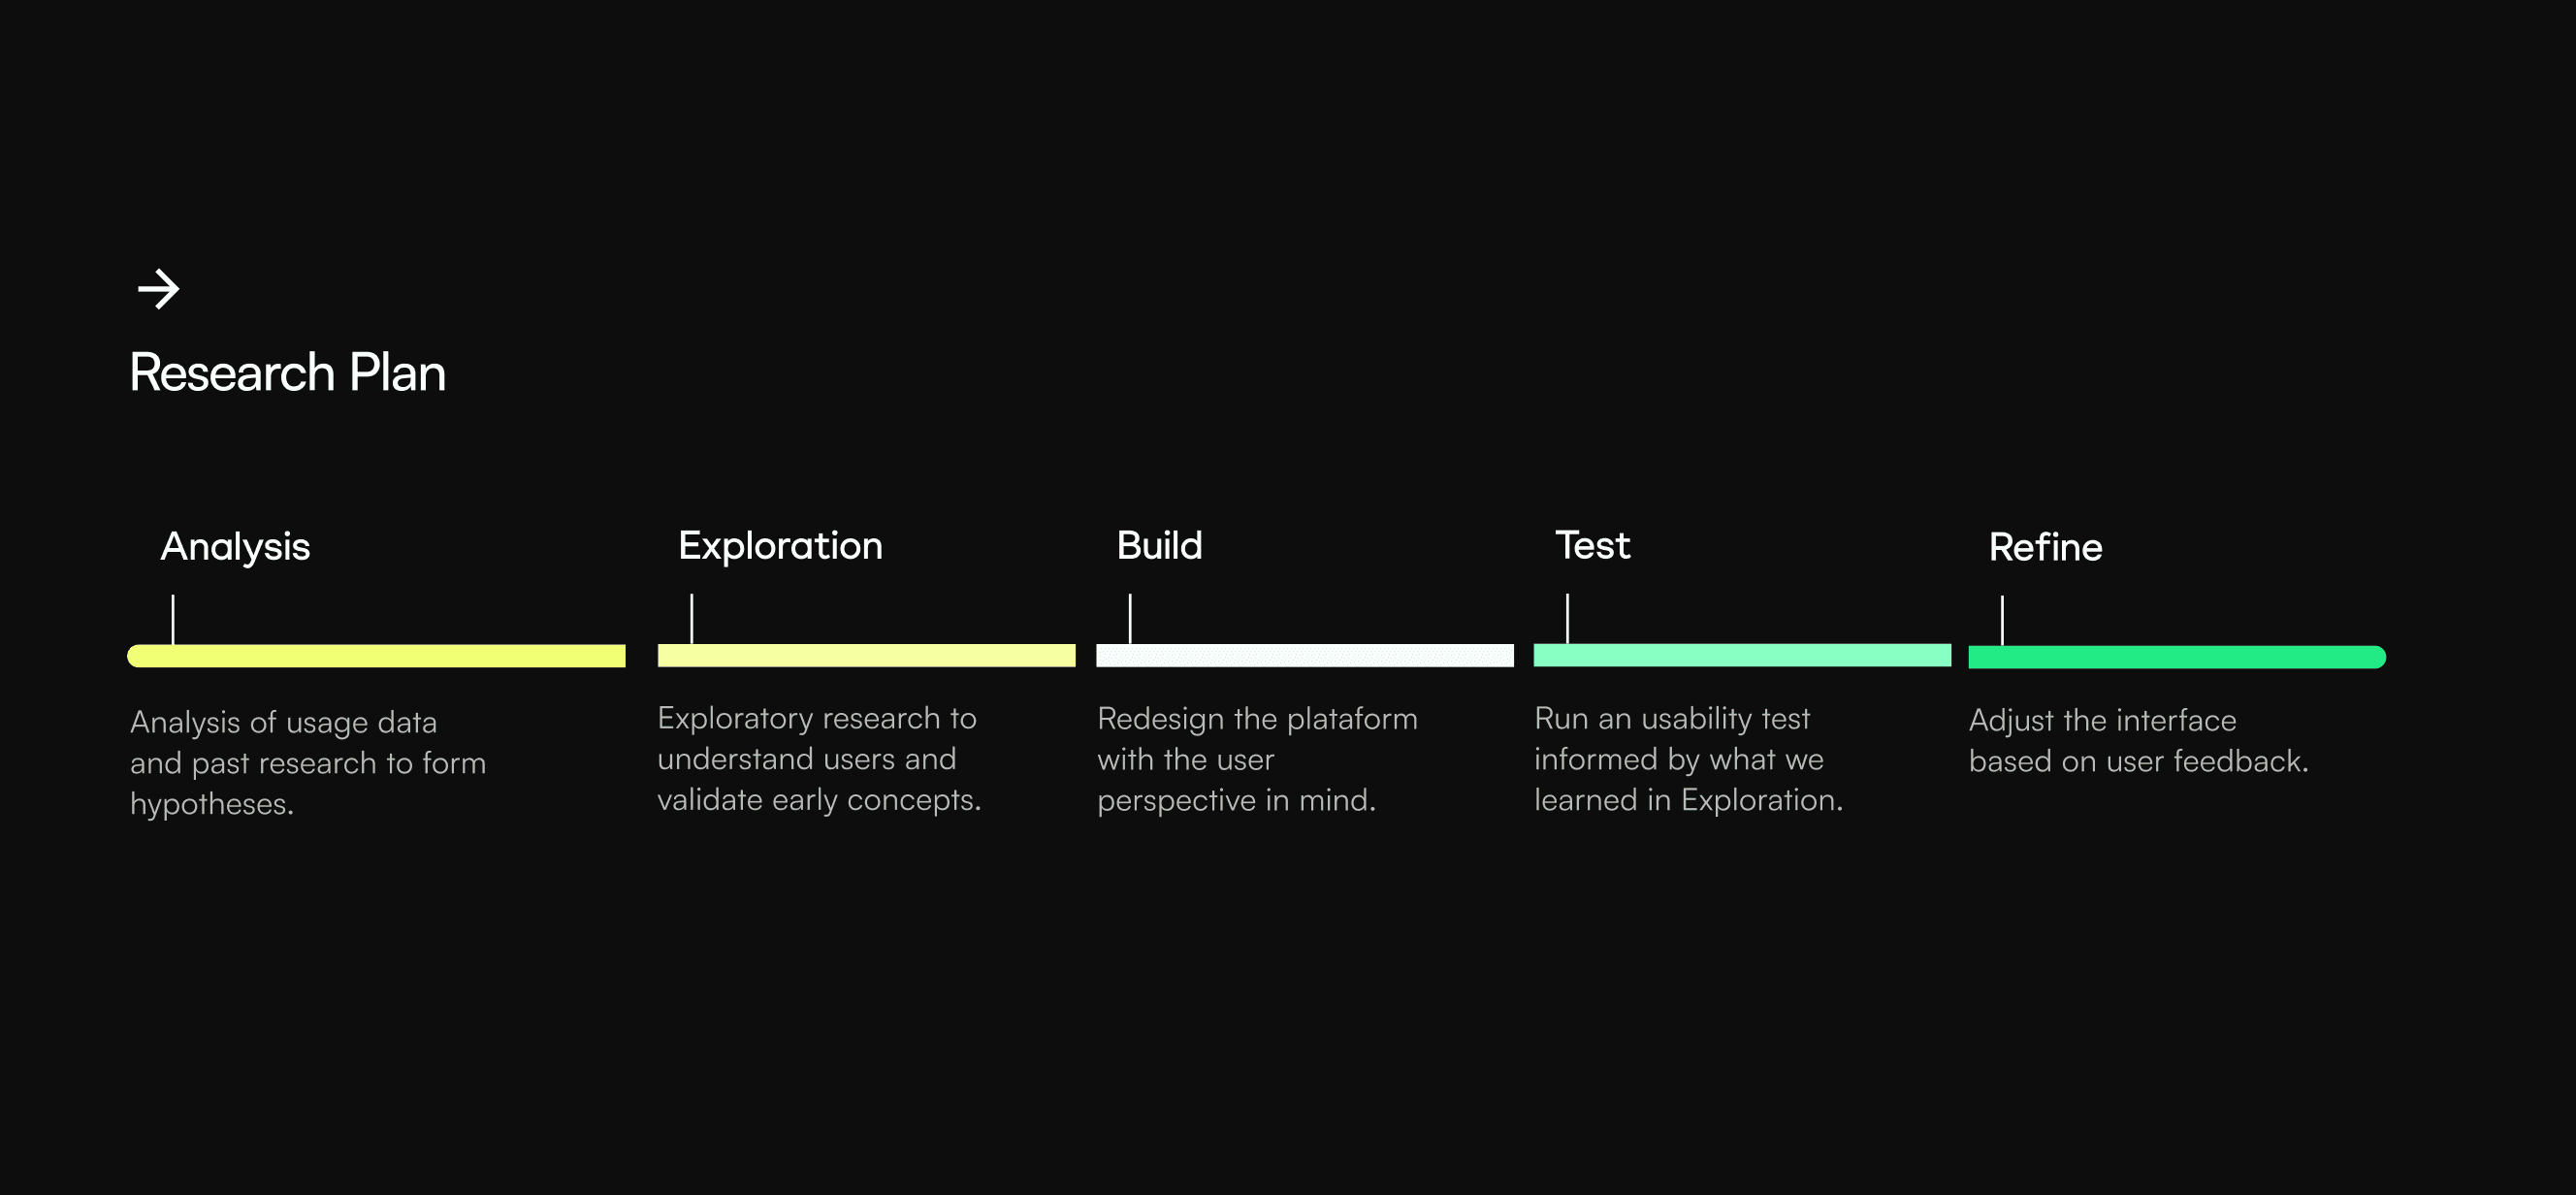
We didn't have answers to any of these. So, to move foward, we structured a research & design plan in five phases: Analysis, Exploration, Build, Test and Refine.
4
Craft
Research clarified the main tasks users needed to perform, engineering helped shape what was possible and where new solutions were needed, and business helped define how that data could drive repurchase. Together, this resulted in a new architecture focused on:
Overview: A personalized place where users can filter any channel, TV or digital, and clearly see what media they bought — insertions, branded content, display, posts, and more.
Audience: A place to see the people each campaign impacted, across all channels.
Conversion: A view of how campaign performance impacts the bottom line of the business.
Reports: A way for users to personalize and automate custom reports, delivering the data exactly when they need it.
This way, we moved away from the siloed view by channel and focused on each advertiser's business strategy — showing the information that matters, with transparency and the best user experience we could deliver.


5
Impact
Although the metrics are not publicly available yet, usability testing showed a significant reduction in tab switching and filter back-and-forth — with the potential to save hours of work in certain workflows. My team and I are currently instrumenting event tracking and setting up satisfaction scores to measure the impact of each new feature.
4h+
Of weakly work reduced from both internal and external users
Positive feedback
Usability testing showed a positive perception of the changes.
Prepared to growth
Channels, metrics, and media types add in without adding complexity.
Campaign Results
Led a full redesign of Campaign Results, rethinking the platform from the ground up with a multichannel perspective. That meant exploring product data, talking to users, and partnering with business and engineering teams to rebuild the entire data visualization system.
Made with
Camila Bruno, Design lead
Juliana Caputo, Staff Research
Murilo Augusto, Product Owner
Tharcyla Mourao, Product Owner
Igor Motta, Data lead
Leonardo Guimarães, Dev Lead
Jessica Rufino, Business Analyst
Renan Iti, Business Coord
1
Context
Known primarily as a broadcast TV network in Brazil, Globo has expanded its advertising portfolio significantly over the years — and each new product arrived with its own systems and metrics. Globo Ads was built to bring these results to advertisers in one place.
But today, that data is still siloed by channel — Broadcast TV, Paid Channels, Digital, and more — each with its own dashboards. The result mirrors how these products were built internally, not how advertisers actually think about their campaigns.
2
The problem
With far more ways to advertise through Globo — social, out-of-home, audio — and with the line between TV and digital increasingly blurred, this siloed way of presenting information won't scale as the business keeps growing.
The challenge then, is how to show this multichannel information without overwhelming the user and losing sight of the workflows they were accustomed to.
3
The challenge
Beyond fix the navigation, the business want to evolve the plataform into an insights hub. But before sketching a single screen, we realized we didn't actually know the basics: Why do users open the platform in the first place? Which features are truly indispensable, which are noise, and what's missing entirely? And what does "an insight" even mean to them?
We didn't have answers to any of these. So, to move foward, we structured a research & design plan in five phases: Analysis, Exploration, Build, Test and Refine.
4h+
Of weakly work reduced from both internal and external users
Positive feedback
Usability testing showed a positive perception of the changes.
Prepared to growth
Channels, metrics, and media types add in without adding complexity.
4
Craft
Research clarified the main tasks users needed to perform, engineering helped shape what was possible and where new solutions were needed, and business helped define how that data could drive repurchase. Together, this resulted in a new architecture focused on:
Overview: A personalized place where users can filter any channel, TV or digital, and clearly see what media they bought — insertions, branded content, display, posts, and more.
Audience: A place to see the people each campaign impacted, across all channels.
Conversion: A view of how campaign performance impacts the bottom line of the business.
Reports: A way for users to personalize and automate custom reports, delivering the data exactly when they need it.
This way, we moved away from the siloed view by channel and focused on each advertiser's business strategy — showing the information that matters, with transparency and the best user experience we could deliver.
5
Impact
Although the metrics are not publicly available yet, usability testing showed a significant reduction in tab switching and filter back-and-forth — with the potential to save hours of work in certain workflows. My team and I are currently instrumenting event tracking and setting up satisfaction scores to measure the impact of each new feature.